

-
Recently Browsing 0 members
- No registered users viewing this page.
-
Latest Activity
-
 that website with the high def a few years did it never reappear? never got a chance to find my tent 😂
 -
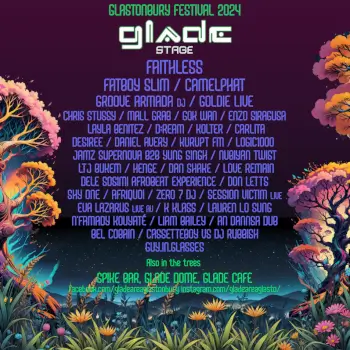
 Janelle is headlining and Sam is the “sub” based on the website (Janelle being on top).
 -
 I've got several sticks from the tree at the Pyramid stage. They were on the ground, I didn't snap them off! Also a nice pink painted skull.
 -
It's a lot lot busier these days. Still the best place on earth but be prepared to queues lot more than in the past. Still amazing though and you must be so excited to go back after a long break
-
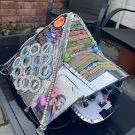
 A few other long lost Shangri-La stages, these all from 2011:
-
-
Latest Festival News
-
Featured Products
-
Hot Topics
-
-
Latest Tourdates


Recommended Posts